A concentration–response curve is the minimum experiment that can say anything about potency, and most of the ways it goes wrong are decided before the first well is filled. Which concentrations, how many, how spaced, what the top one is limited by, what sits in the vehicle well — those choices determine whether the curve can be fitted at all. This is the in-vitro design in its plain form, with the decisions that matter and the ones that only look like they do.
Why a curve and not a point
A single concentration produces a single number, and a single number cannot distinguish a potent compound at a low concentration from a weak one at a high concentration. Two compounds compared at one matched concentration can rank either way depending on which concentration was chosen — the mistake that survives peer review. A curve resolves this by locating the concentration at which the response is half-maximal, the EC50, and the size of the maximal response, and those two parameters are what published comparisons are made of.
The decisions, in order
| Decision | Usual answer | Why |
|---|---|---|
| Spacing | Logarithmic, half-log steps | Responses follow log concentration; linear spacing wastes points |
| Number of concentrations | 8–10 | Enough to define both plateaus and the slope between |
| Range | At least 3 log units, EC50 near the middle | Both plateaus have to be reached, not inferred |
| Top concentration | Limited by solubility or toxicity, checked | An artefact at the top flattens or inverts the curve |
| Vehicle control | Matched for diluent, salt and carrier | Defines the zero the curve is measured from |
| Replication | Biological replicates, not only technical | Wells from one preparation share its errors |
Why half-log steps rather than doubling?
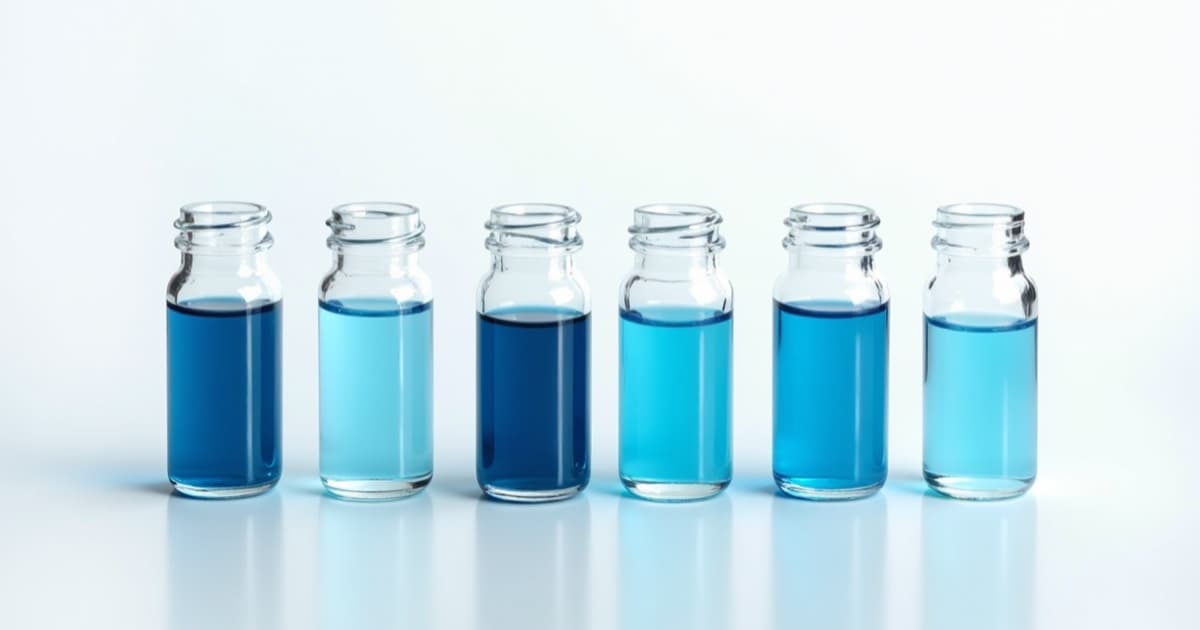
Because receptor occupancy is a function of log concentration, and the sigmoid a curve fits is roughly symmetrical on a log axis. Half-log steps — 1, 3, 10, 30, 100 — put points evenly along the informative part of the sigmoid. Doubling steps crowd the low end and thin out the high end, so the top plateau is often defined by one or two points, which is where the fit fails. Three points per decade is the practical minimum; if the range is uncertain on a first pass, a wider range at whole-log spacing followed by a second pass at half-log around the EC50 costs less than a single dense run in the wrong place.
How is the top concentration chosen?
By finding what breaks first. Two things limit it: the compound's solubility in the assay medium, and the point at which the compound or its vehicle becomes toxic or otherwise disruptive to the readout. Both should be checked directly rather than assumed — a top concentration that has precipitated produces a response that flattens or falls, and it is easy to read that as a genuine maximum. Aggregation at high concentration is the peptide-specific version of this, and it is not visible in a well.
The peptide-specific traps
General assay design covers most of it. Three problems belong to peptides in particular.
The low end loses material to plastic. Below about 1 µg/mL, a fraction of the peptide is on the wall rather than in the well, and the fraction grows as the concentration falls. The bottom of a curve is therefore run at concentrations lower than intended, which shifts the apparent EC50 rightward. Low-binding plates and a carrier protein, where the assay tolerates one, are the answer; the serial dilution being made in low-binding tubes matters as much as the plate.
The nominal concentration is not the peptide concentration. A stock calculated from label mass overstates the peptide by whatever the net content falls short of 100%, and that error runs through every dilution identically. Correct at the stock, once, from the certificate.
Albumin in the medium sequesters acylated peptides. For anything carrying a fatty acid chain, serum in the medium binds most of the compound and the free concentration is a small, unknown fraction of the nominal one. Serum-free conditions, or a defined albumin concentration reported in the methods, are what make the result comparable to anyone else's. Serum also carries the peptidases that remove an unmodified peptide within minutes.
What belongs in the vehicle well?
Everything that is in the compound wells except the compound — and that is a longer list for peptides than it looks. The diluent, at the same final dilution. Any acid used to dissolve the peptide. Any carrier protein. And, for a trifluoroacetate salt, ideally a matched amount of TFA, since it is not inert in every cell system. A vehicle well containing only medium defines a zero the compound wells were never measured against.
How many replicates, and of what kind?
Technical replicates — several wells from one dilution series — measure pipetting and plate variation, and they are cheap. They do not measure the error in the dilution series itself, which every well shares. Biological replicates — independent preparations, ideally on different days, ideally from different aliquots of stock — are what an EC50 with a confidence interval is built from. Three independent curves with triplicate wells is a common and defensible minimum; nine wells from one series is not three replicates, whatever the plate map says.
What should be reported so someone else can repeat it?
The compound with lot and net peptide content; the exact concentrations, as molarity, with the molecular weight used; the plasticware; the medium and its serum or albumin content; the vehicle composition; the time between addition and readout; the fitting model and its constraints; and the number of independent experiments behind each point. Most methods sections omit half of this, and the omissions are precisely the variables above that move an EC50 by an order of magnitude. The certificate supplies the first item; the rest is a matter of writing down what was done.
All products referenced here are supplied for laboratory and research use only. They are not drugs, foods, supplements or cosmetics, and are not for human or veterinary use.