
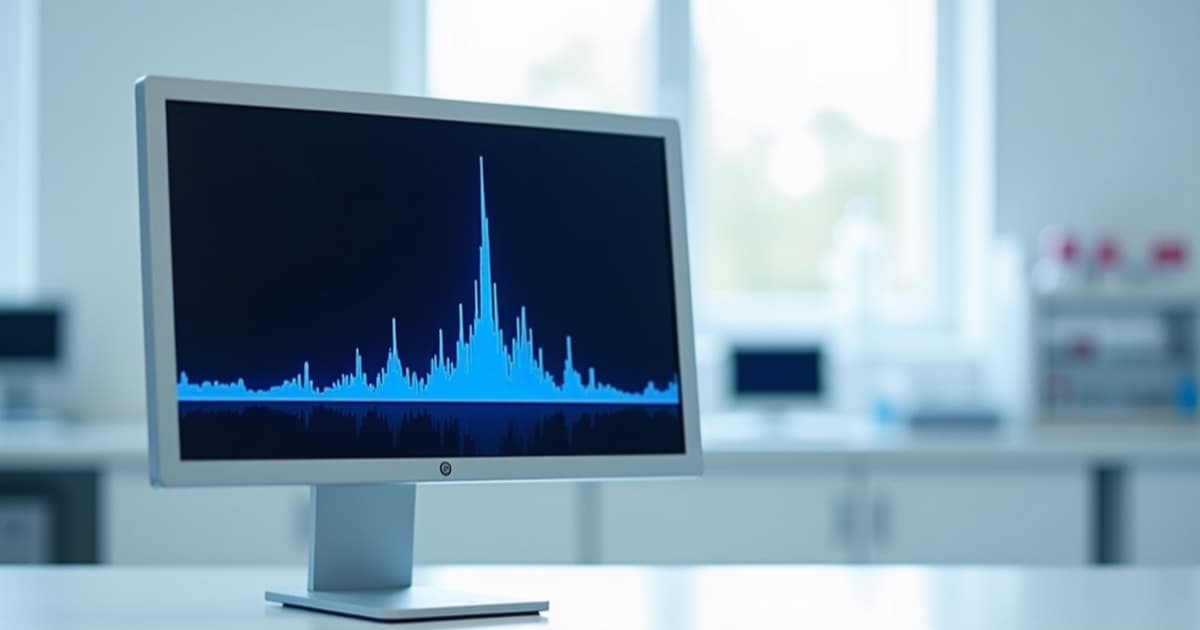
A chromatogram is a graph of what left the column, when, and how much of it there was — and every purity figure on a certificate was read off one. Learning to read the trace takes about as long as reading this, and it converts a number you are asked to trust into a picture you can judge. Most of what a purity figure hides is visible on the chromatogram it came from.
What the axes mean
The horizontal axis is time. A sample is injected onto a column, a solvent gradient washes components off in order of how strongly they cling to the packing, and each one arrives at the detector at a characteristic time — its retention time. For peptides on a reversed-phase column, more hydrophobic sequences are retained longer.
The vertical axis is detector response: for peptides, almost always ultraviolet absorbance at 214 nm, where the backbone amide bond absorbs. A peak's height is how much was passing the detector at that instant; its area is how much passed in total. Area is what gets integrated into a purity figure.
| Feature | What it tells you |
|---|---|
| Main peak retention time | Identity check against a reference; shifts with method, not compound |
| Peak shape | Symmetric = clean elution; tailing or shoulder = something co-eluting or column trouble |
| Small peaks near the main peak | Close relatives: deletion sequences, oxidised forms, diastereomers |
| Peaks far from the main peak | Unrelated impurities, or aggregates and dimers late in the run |
| Solvent front | Unretained material at the start; excluded from integration |
| Baseline | Where zero was drawn; a drifting baseline moves every area |
Why does the main peak's position not identify the compound?
Because retention time is a property of the method as much as of the molecule. Change the gradient, the column, the temperature or the additive and the same peptide arrives at a different time. A retention time is meaningful against a reference standard run under identical conditions, and nearly meaningless across laboratories. Identity comes from mass spectrometry; the chromatogram separates and quantifies, and it is worth keeping those two jobs distinct when reading a certificate.
What should the main peak look like?
Sharp, symmetrical, and standing on a flat baseline. Three departures are worth noticing. A shoulder — a bump on one side — is a second component that the method has not fully resolved from the main one, and its area may have been integrated into the main peak's. Tailing, where the peak's trailing edge stretches out, usually indicates an interaction with the column rather than an impurity, but it makes integration ambiguous. A broad peak where a sharp one is expected can mean aggregation or a slowly interconverting conformation. None of these appears in the purity figure; all of them appear in the trace.
Where the purity figure comes from
An integration routine draws a baseline, decides where each peak starts and ends, and sums the areas. Purity is the main peak's area as a fraction of the total. Every step involves a choice, and the choices move the number.
The baseline can be drawn high or low. A shoulder can be split off or included. The solvent front can be excluded generously or narrowly. A run can be stopped before late-eluting material appears, which removes it from the denominator entirely. A figure of 98.7% produced with one set of choices might be 97.9% with another, on the same injection. The figure is an area ratio, not a weighing, and the trace shows the decisions that produced it.
How can I tell if the run was long enough?
Look at the end. A gradient normally finishes with a high-organic wash that pulls off anything strongly retained, and a trace that ends immediately after the main peak may simply have stopped before those components eluted. Dimers, aggregates and hydrophobic impurities arrive late, and a run truncated before them reports a purity that never counted them. A certificate trace that shows the full gradient, including the wash, is showing you the denominator.
What do the small peaks next to the main one usually contain?
Close relatives of the target, because those are the impurities synthesis produces and purification struggles to remove. A peak just before the main one is often a deletion sequence or an oxidised form, both slightly more polar. A peak just after is often a diastereomer — the same sequence with one residue's stereochemistry flipped — or a protected fragment carrying a leftover group. A certificate that labels these peaks is describing the batch; one that reports them as anonymous percentages is describing the method.
Why is 214 nm used, and what does that change about the trace?
Because every peptide bond absorbs there, so every peptide-related component shows up in rough proportion to its size. At 280 nm only aromatic residues absorb, which makes a peptide without them nearly invisible and gives a trace that overstates aromatic-rich impurities. A trace at 214 nm sees the counter-ion too if it absorbs — trifluoroacetate does, weakly — and solvent-front artefacts are larger. Knowing the wavelength tells you which components the trace can and cannot see, which is the first thing to check before comparing two chromatograms.
Should I ask for the trace, or is the figure enough?
Ask for the trace whenever the figure is going to carry weight — anything reported, anything compared between lots, anything near a specification limit. A number alone asks you to accept a baseline you did not see and an integration you cannot check. The trace lets you judge peak shape, run length and what was excluded, in about thirty seconds. A certificate that includes it has made the strongest available commitment; one that does not is not necessarily hiding anything, but it has left the judgement to the supplier rather than to you.
All products referenced here are supplied for laboratory and research use only. They are not drugs, foods, supplements or cosmetics, and are not for human or veterinary use.